Mitasys × 1Finance · Organic search

Apr-Jun 2026 vs Jan-Mar 2026 · Google Search Console

Organic clicks fell about a third quarter on quarter.

Blog and Calculator drove 91% of the loss, and it is almost entirely non-branded. Branded demand grew and held rank, so this is a discovery problem, not a brand problem.

What happened

Organic clicks fell 30.6% between the two quarters.

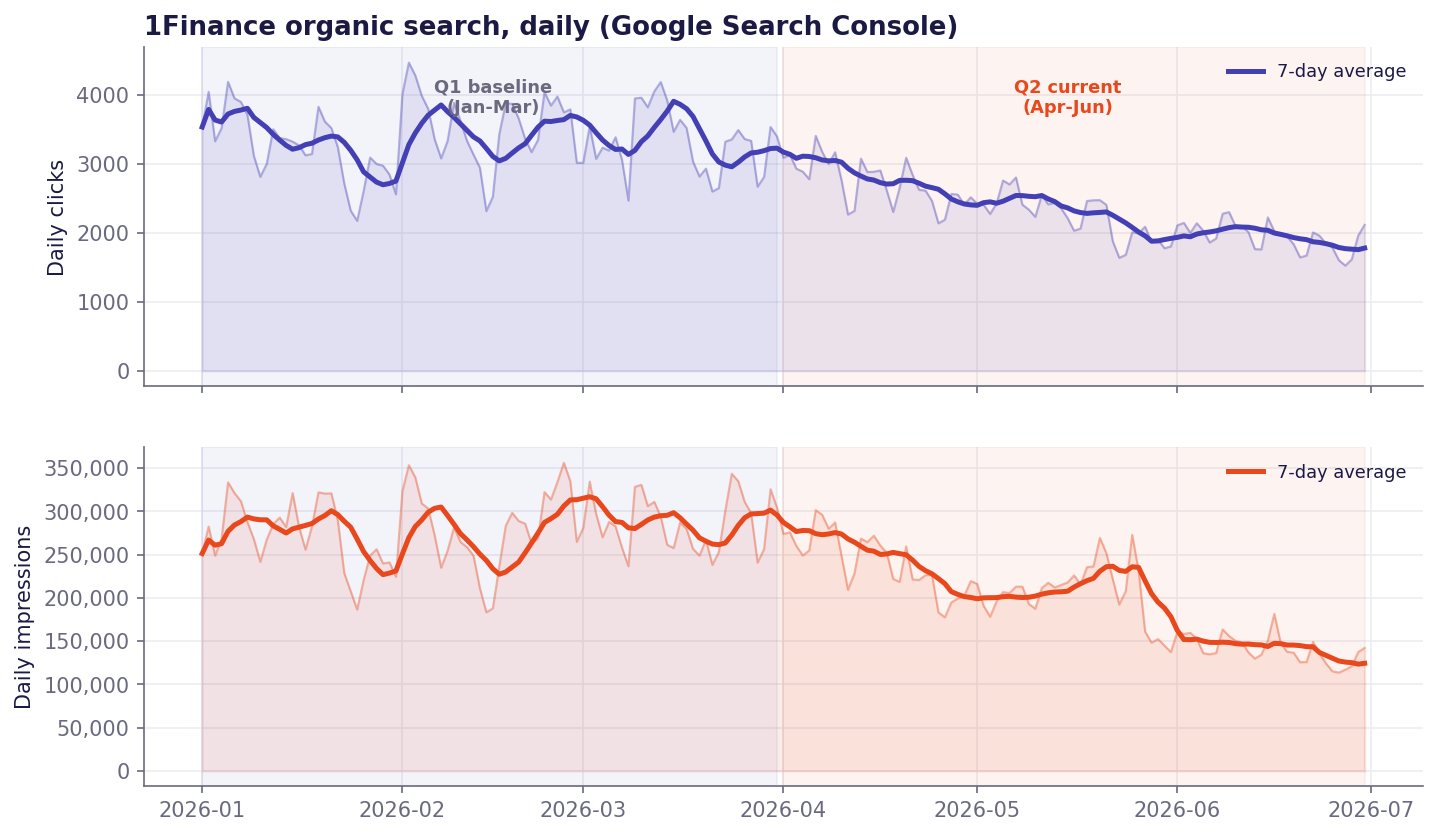
Clicks fell from 303,510 in Q1 (Jan-Mar) to 210,678 in Q2 (Apr-Jun), a loss of about 92,800. Impressions fell in step, down 29.6%.

Organic clicks, Q2

210,678

down 30.6% from 303,510 in Q1

Non-branded clicks

−35%

the entire net decline sits here

Blog + Calculator

91%

share of the total click drop

Branded clicks

+35%

brand demand grew and held rank

Daily organic clicks and impressions, January to June 2026, with the Q1 baseline and Q2 current windows shaded.
Daily organic clicks and impressions across both quarters (7-day average). The Q2 window sits clearly below the Q1 baseline.

Where it went

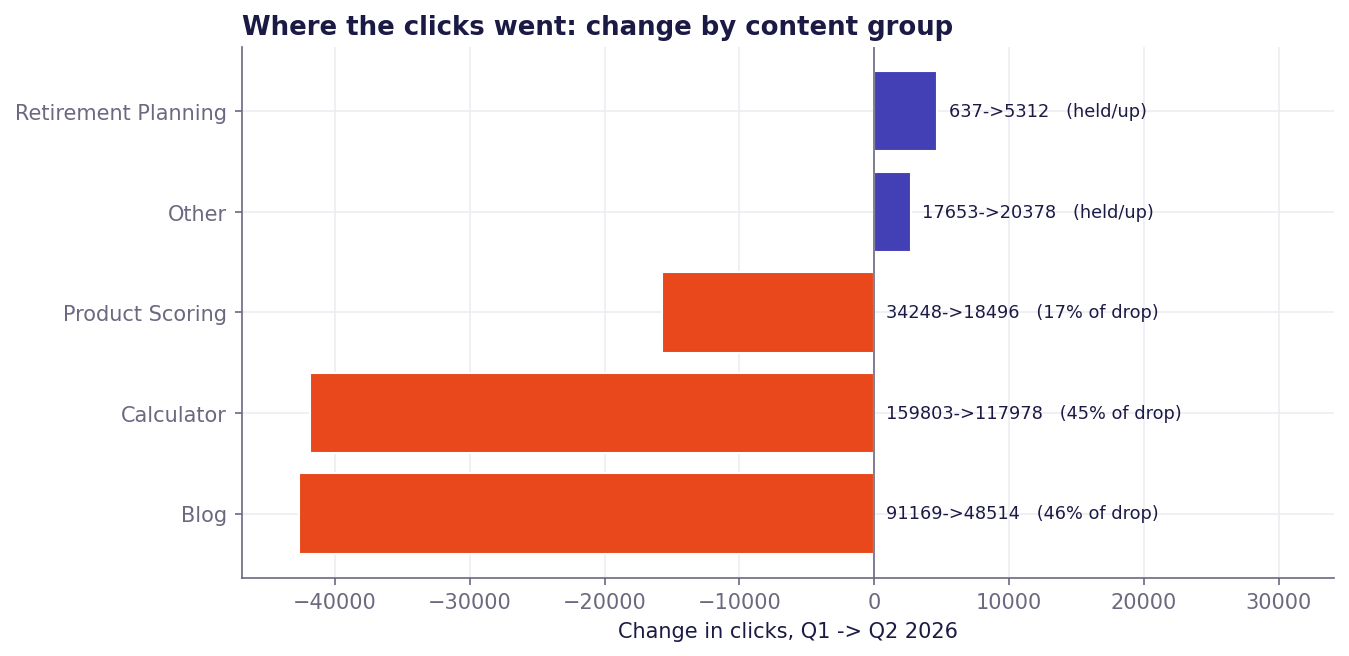
Two sections account for 91% of the loss.

Blog and Calculator each shed about 42,000 clicks. Product Scoring adds a further 17%, offset by gains in Retirement Planning and the homepage.

Change in clicks by content group, Q1 to Q2 2026. Blog and Calculator show the largest losses; Retirement Planning and Other gained.
Content groupClicks: Q1 → Q2ChangeShare of drop
Blog 91,169 → 48,514 −42,655 46%
Calculator 159,803 → 117,978 −41,825 45%
Product Scoring 34,248 → 18,496 −15,752 17%
Retirement Planning 637 → 5,312 +4,675 gained
Other (home, glossary, etc.) 17,653 → 20,378 +2,725 gained

Within Product Scoring, Credit Card is the story

The NPS-scheme line did not vanish; those pages moved to the Retirement Planning section, which is why Retirement Planning gained at the same time. Credit Card is the genuine product-scoring decline.

Product lineClicks: Q1 → Q2ChangeShare of section drop
Credit Card 24,148 → 14,063 −10,085 64%
NPS Schemes (moved to Retirement Planning) 2,680 → 1 −2,679 17%
Health Insurance 4,975 → 2,553 −2,422 15%
Home Loan Lenders 1,271 → 920 −351 2%
Mutual Funds 791 → 608 −183 1%

A handful of pages drove most of the loss

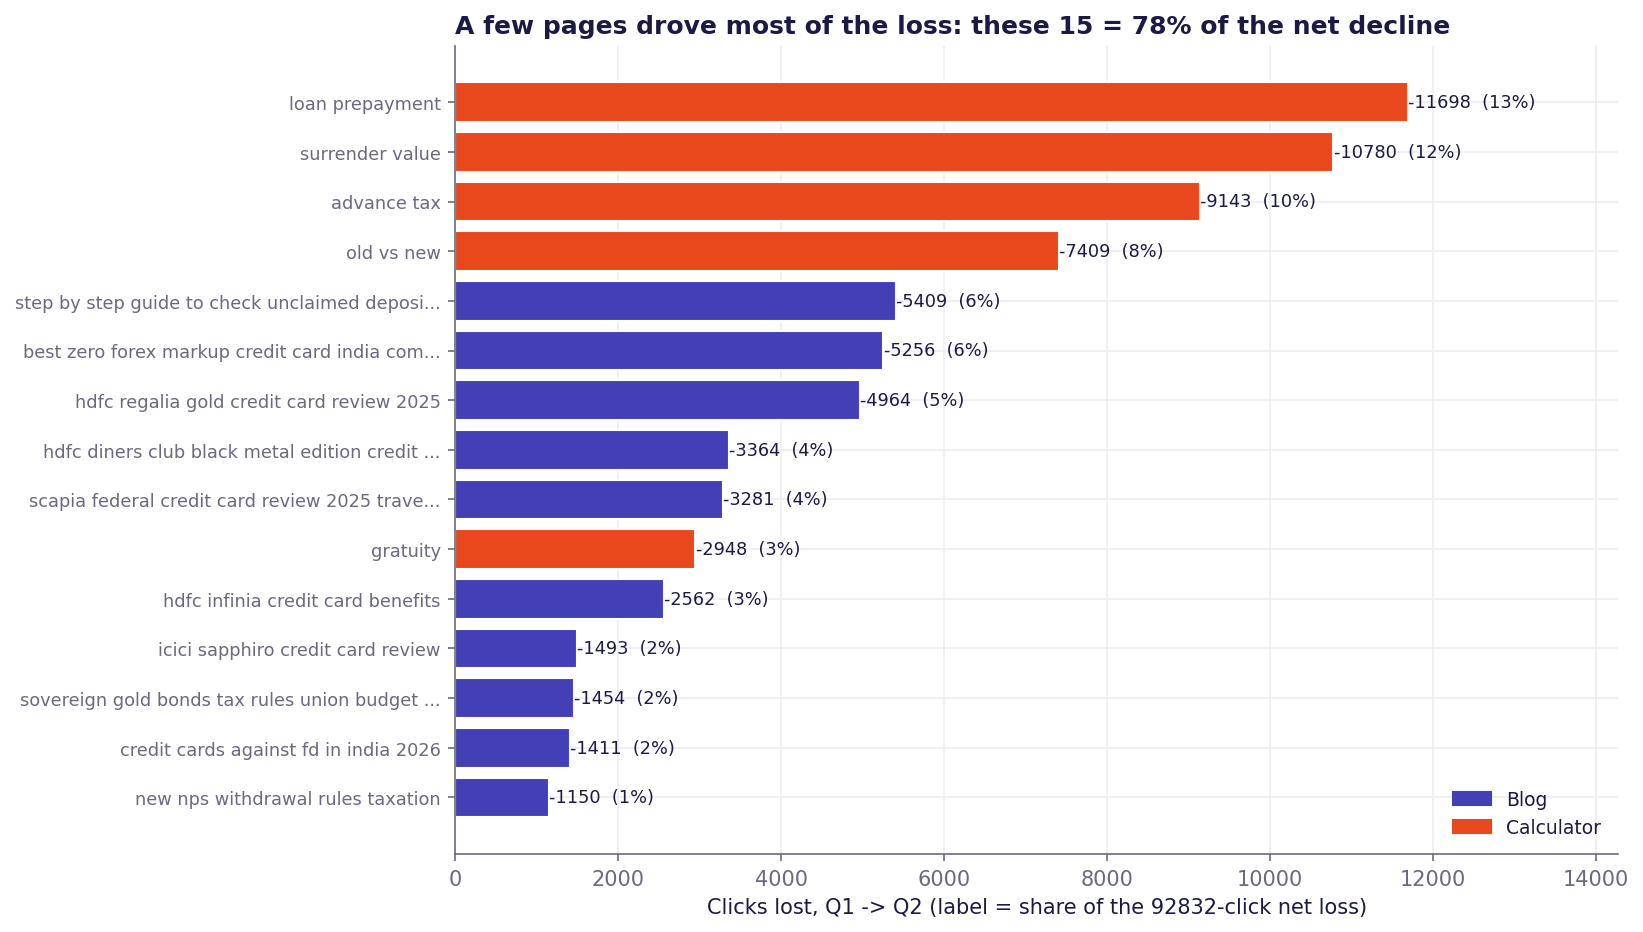
The individual pages that lost the most clicks, Q1 to Q2 2026, coloured by content group.
PageClicks: Q1 → Q2ChangePosition: Q1 → Q2
Loan prepayment calculator held rank 63,062 → 51,364 −11,698 14.9 → 10.1
Surrender value calculator held rank 31,433 → 20,653 −10,780 14.6 → 8.1
Advance tax calculator held rank 11,298 → 2,155 −9,143 6.0 → 7.1
Old vs new tax regime calculator held rank 15,040 → 7,631 −7,409 7.2 → 7.3
Unclaimed deposits guide (blog) 6,304 → 895 −5,409 4.7 → 6.4
Zero-forex credit card list (blog) 8,116 → 2,860 −5,256 4.7 → 7.2
HDFC Regalia 2025 review (blog) held rank 5,955 → 991 −4,964 4.4 → 5.1

What this means

The biggest Calculator pages held or improved their rankings while still losing clicks, which points to seasonal tax-tool demand and zero-click behaviour, not a ranking problem. The Blog is a mix of genuine ranking loss on evergreen posts and a year-based content refresh where traffic moved to newer URLs.

Why

Non-branded search fell; branded search grew.

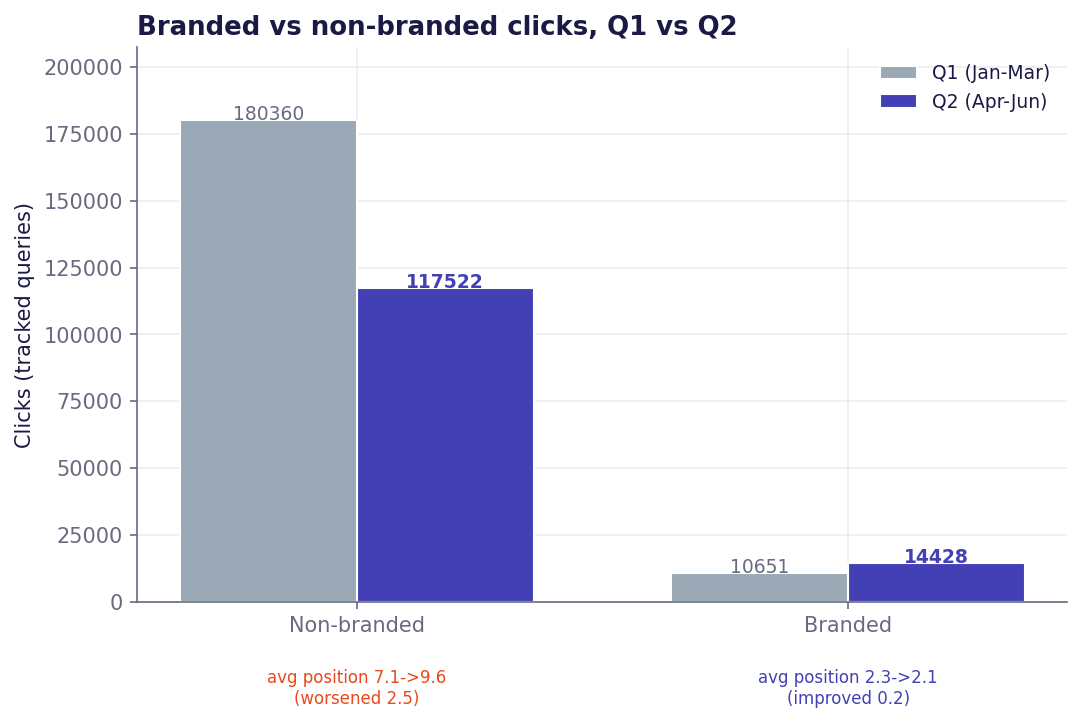
The whole net decline sits in non-branded queries, where average position also slipped. Branded demand grew 35% and held its top position, so the trust and recall side of the funnel is intact.

SegmentClicks: Q1 → Q2ChangeAvg position
Non-branded 180,360 → 117,522 −35% 7.1 → 9.6 (worsened)
Branded 10,651 → 14,428 +35% 2.3 → 2.1 (improved)
Branded versus non-branded clicks, Q1 versus Q2, with average position change.
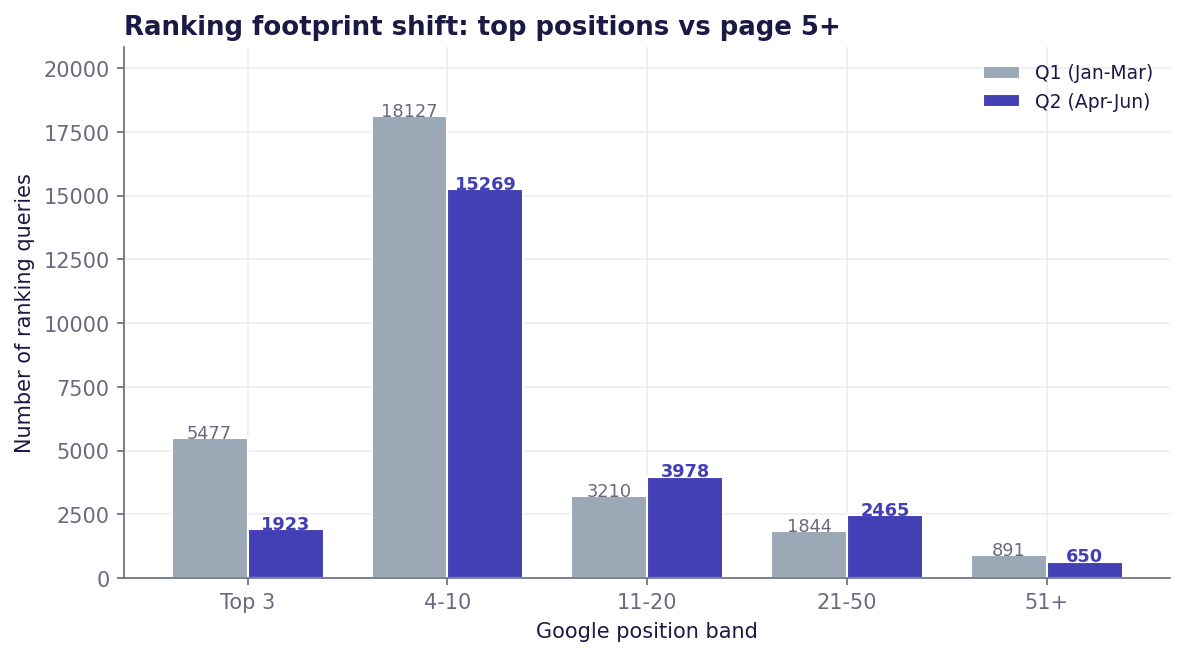
Number of ranking queries per Google position band, Q1 versus Q2.

The ranking footprint slipped, but the top pages held

Queries ranking in the top three positions fell nearly two thirds (5,477 to 1,923), redistributing to page two and beyond. Yet when we checked the highest-traffic decliner pages against their own key terms, 12 of 15 held their rankings, so for those pages the clicks left without the rank moving.

Google position bandQueries in Q1Queries in Q2
Top 35,4771,923
4 to 1018,12715,269
11 to 203,2103,978
21 to 501,8442,465
51+891650
01

Zero-click and AI answers

Non-branded "what is" and "how to" queries are increasingly answered on the results page, so a page can hold rank and still lose the click.

02

Seasonal tool demand

Tax calculators and regime comparisons peak in the January-to-March tax-planning quarter and recede afterwards. A quarter-on-quarter view always shows that swing.

03

Real ranking loss on the mid-tail

Beyond the top pages, the broad Blog mid-tail did lose position, shown by the top-three collapse above. This part is recoverable with on-page work.

04

Brand strength is intact

Branded clicks and rankings grew. The opportunity is recapturing non-branded discovery, not repairing brand demand.
The way forward

What to do next.

Priorities, ordered. Full page-level detail is in the report.

PriorityActionWhy it matters
Must-fix Rebuild top-three visibility for the Blog mid-tail that lost rank (unclaimed-deposits, zero-forex list, and similar evergreen guides). The top-three query count fell 65%; this is the clearest recoverable loss.
Must-fix Optimise the high-traffic evergreen calculators (loan-prepayment, surrender-value) for the answer box and richer results. They hold rank but leak clicks; snippet and CTR work recaptures demand that rank alone no longer converts.
Should-fix Complete the year-based refresh cycle for product-review blogs so the current-year versions absorb the older posts' equity. The 2025 posts decay by design; the 2026 versions already rank and should be consolidated cleanly.
Should-fix Confirm the NPS-scheme move (Product Scoring to Retirement Planning) is fully redirected. The migration explains part of the swing; a clean redirect protects the recovered traffic.
Nice-to-have Treat the tax-tool seasonality as expected and plan the next tax-season content push ahead of Q4/Q1. The swing is predictable; planning around it turns a reported drop into a managed cycle.

Open the full report →